
Prefetching in memory-intensive applications
In the previous post we have been looking on various, sometimes intrusive and complicated methods of compacting data structures for providing better memory and cache usage. Today we will continue with other method of improving performance for data intensive applications: prefetching.
Data flow in computer system
Before starting with showing examples, let’s think about how and when actually data moves from memory to CPU. Imagine very simplistic example: calculating sum of array elements.
uint64_t data[64000];
uint64_t sum = 0;
for(int i=0;i<64000;i++) {
    sum += data[i];
}
The simplest system has memory functionally connected directly to the CPU, which means data is loaded and stored from processor registers to memory. On such system memory will be accessed every time data[i] is referenced. In modern CPU that would be a disaster as access to RAM is slow, in range of ~100ns (where one CPU cycle is ~0.4ns). Fortunately, most CPUs including small embedded ones are more sophisticated than that.
To improve performance, back in ’80s mainstream computer systems were enhanced witch cache, in most cases many levels of it. A cache is a very fast memory, sitting between CPU and RAM, while usually being physically integrated into the CPU. On systems equipped with a cache, when reading a value from memory to register, a chunk of data near the requested address is loaded to the cache. This chunk of data has fixed size (almost always 64 bytes), is aligned to its size and is called the cache line. Whenever accessing data from this chunk, there is no need to read it from the main memory, but rather from a much faster cache. In our example, where data is accessed in 64bit (8 bytes) chunks, only every 8th iteration CPU will have to wait on memory access.
This design was enhanced even further with the introduction of speculative prefetching.
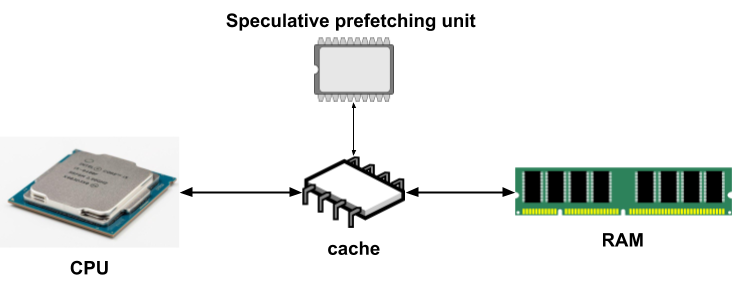
This idea is based on the fact that data in most cases is accessed predictably and can be read ahead of time to cache. The simplest case of predictability is continuous linear memory access, exactly as in our example. Any relatively modern CPU will notice that data is accessed linearly and read a few consecutive lines of cache, to be available when needed. This way in our example there will be almost no memory stalls (at least in theory). This process of reading data from RAM to cache, ahead of time is called prefetching. Predicting which cache line to read next is not limited to continuous access, it works well also for stride access where processing every Nth element in memory. There is much more into that topic, like multiple cache levels, cache policies, cache synchronization protocols but describing those details would be out of scope for this article.
Practical examples
Prefetching descriptors
Let’s get back to our example of processing packet descriptors from the previous article. We will use a structure with the best overall performance profile: PacketDescriptorPacked and try to improve it further with prefetching. Prefetching of arbitrary memory location can be done using: __builtin_prefetch which details can be found in GCC documentation. The only obligatory argument is a pointer to memory location requested for prefetching. Of course, not only the exact address will be loaded, but an entire 64 bytes cache line. A pointer can be invalid or null, which is useful because in most cases bound checking can be ignored saving a few CPU cycles. There are two additional arguments to __builtin_prefetch, but those are not important here.
Now let’s try and add prefetching into the benchmark loop. How much data to prefetch ahead of time? In theory, this depends on many factors like cache size, memory latency, time to process a single line of cache worth of data. This is very difficult to evaluate properly, so the best option is to just try multiple values and measure.
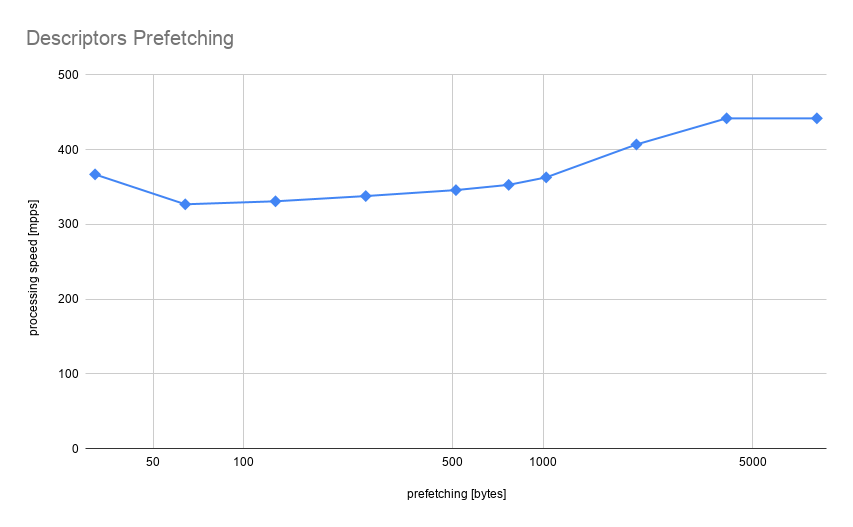
Performance improvement was moderate at most. The reason for that was already mentioned before: CPU is smart enough to do prefetching for us. Access pattern in the benchmark is completely linear which is extremely easy to predict. Data are being prefetched transparently and probably the only reason for improvement observed is hardware prefetcher being too conservative and not prefetching more than 1kb ahead. Also, we can observe performance degradation for small values, this is an important indication that prefetching is not for free and introduces some overhead: i.e prefetching data already in cache will be no-op wasting CPU cycles.
Prefetching payload
Another example applicable to working with network packets is iterating over packet descriptors but processing also payload pointed by one of the descriptor structure fields. This has a dramatic impact on memory access pattern: descriptors are placed back to back, one after another, but payload can be in a completely different memory locations, not adjacent to one another. This pattern is not possible to predict and gives more space for performance improvements.
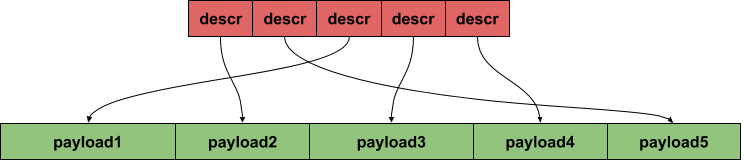
Benchmark simulating this kind of processing is implemented in the ProcessDescriptorsPayloadRead function. The algorithm is completely trivial, iterating over descriptors and summing up the first word from packet payload. Having learned from the previous example, we are not prefetching descriptors, only payload for a different number of packets ahead. CPU has no way of knowing our data structures, so issuing prefetch instructions gives CPU a hint which data will be needed soon.
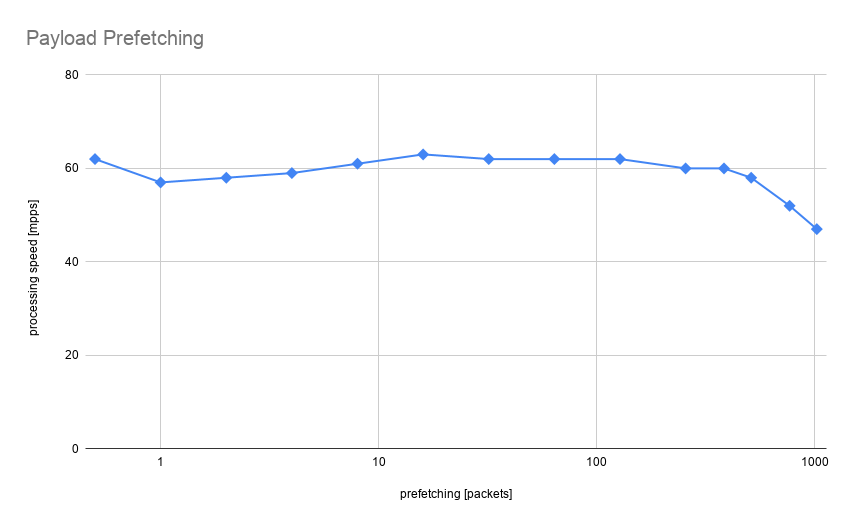
Surprisingly there was even less performance improvement than previously and performance degradation when prefetching more than 256 packets. This is because time spent in processing data is so minuscule compared to the time needed to load (or prefetch) data that memory bandwidth became a limiting factor. No prefetching amount can improve that significantly, the memory bus is busy almost all the time and giving hints which data will be needed is not going to help. For prefetching to make sense and improve anything it needs to have a chance of running “in the background”. There has to be some amount of time when CPU is processing the current batch of data so future data can be prefetched.
Prefetching payload with heavy processing
A modified example implemented in ProcessDescriptorsPayloadReadHeavy simulates more time-consuming data processing. Now there are periods where CPU is busy crunching data already available in cache and future data can be loaded in the background.
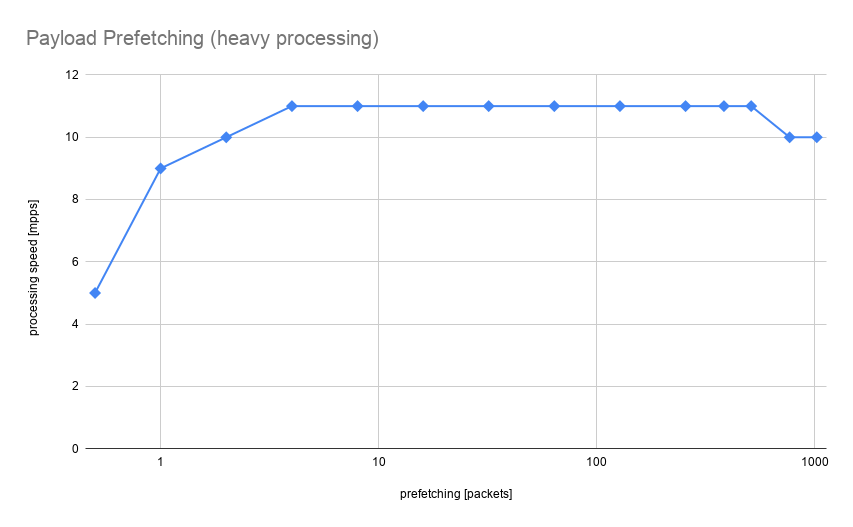
Here performance improvement is much more significant. The performance went from 5mpps when not prefetching to 11mpps when prefetching 4 packets ahead. As for quite simple, safe and localized change, this is an impressive result. It shows prefetching as a powerful performance improvement for memory-bound applications. There are some prerequisites, like certain processing-to-memory-access ratio and keeping prefetching logic as minimal as possible, so that our improvements are not diminished by it, but overall this makes good and relatively simple optimization technique.
Bonus: optional arguments
__builtin_prefetch has two additional parameters: rw and locality.
rw indicates if prefetched memory is going to be used to read or write. This sounds simple in theory but it is more complicated to make it work in practice. One issue is that only most modern CPUs support it. According to gcc manual Intel has it since broadwell architecture. So there is need either for targeting application only fo the latest CPUs or for CPU architecture dispatching. The second more complex issue is that it is hard to find a case where write prefetching makes any difference. On the first glimpse, it seems that when loading data to cache, it makes no difference if the CPU is going to read or write it later. But there are some cases in multi-core and especially multi-socket systems, where it can make quite a lot of difference. It concerns mostly invalidating cache on remote CPUs so that when writing to cache, there will be no need for cache sync-up between CPUs. This is not easy to simulate and this topic requires more study on my side.
As for locality, it is supposed to indicate a degree of temporal locality. A value of zero means that the data has no temporal locality, higher values mean more temporal locality. This probably has something to do with levels of cache where data needs to be loaded, but let’s just try it out and see what difference does it make.
                    LOCALITY
PREFETCHING    0     1     2     3
0             62    62    62    62
1             57    57    57    57
2             58    58    58    58
4             59    59    59    59
8             61    61    61    61
16            63    63    63    63
32            62    62    62    62
64            62    62    62    62
128           62    62    62    62
256           60    60    61    60
384           60    60    60    60
512           58    58    58    58
768           52    52    52    52
1024          47    47    47    47
There is no measurable difference for any value of locality, so either it requires some special conditions to work or it is just not functional for this CPU architecture.
Tracing memory performance
It is not trivial to correctly identify and solve memory bottlenecks even in simple applications. How can we know that our application is limited by memory bandwidth? Which changes are reducing memory stalls? Fortunately, CPU provides various hardware counters storing many types of events like memory reads, reads served by a cache (cache-hits), reads served by main memory (cache-misses). Those counters can be accessed programmatically, as instrumentation in code i.e for performance-critical parts of the application or by using perf stat tool.
Running it requires specifying which counters we are interested in and application we want to measure:
perf stat -e cache-misses,cache-references,cycles,instructions,L1-dcache-loads,L1-dcache-misses,LLC-loads,LLC-load-misses ./PacketDescriptorsPrefetching
Here we have specified counters responsible for various levels of data cache and ones that can show instructions per cycle.
Results without payload prefetching:
Prefetching 4 pointers ahead
Payload read processing performance long: 9 mpps
        2191257897      cache-misses              #   78.771 % of all cache refs      (49.99%)
        2781792905      cache-references                                              (50.00%)
      364710082877      cycles                                                        (50.01%)
      236285106758      instructions              #    0.65  insn per cycle           (62.51%)
       38528300611      L1-dcache-loads                                               (62.51%)
        3000142952      L1-dcache-misses          #    7.79% of all L1-dcache hits    (62.51%)
        1209407796      LLC-loads                                                     (62.50%)
         670348079      LLC-load-misses           #   55.43% of all LL-cache hits     (62.49%)
Results with prefetching:
Prefetching 0 pointers ahead
Payload read processing performance long: 4 mpps
        2156820650      cache-misses              #   78.719 % of all cache refs      (50.00%)
        2739896913      cache-references                                              (50.00%)
      176376504963      cycles                                                        (50.01%)
      239466479151      instructions              #    1.36  insn per cycle           (62.51%)
       39593265565      L1-dcache-loads                                               (62.51%)
        2957529169      L1-dcache-misses          #    7.47% of all L1-dcache hits    (62.50%)
         574832230      LLC-loads                                                     (62.49%)
          48264412      LLC-load-misses           #    8.40% of all LL-cache hits     (62.49%)
To some surprise general cache-misses and L1-dcache-misses stays the same. But there is a clear difference in LLC-load-misses (LLC stands for last level cache, so L3 on this particular CPU). The number of cache-misses, so events, when data were not present in the cache and had to be read from main memory, have decreased drastically. Also improved insn per cycle shows that CPU was able to spend more time executing code and less waiting on memory.
Summary
Hopefully, this post has proven prefetching as a viable technique for improving performance in memory-intensive applications. Having some knowledge about CPU and cache architecture as well as some profiling tools can be very helpful in chasing bottlenecks. Also, it is worth remembering that prefetching is very architecture-dependent and volatile: what works well on one CPU can work different way on another. It is always important to know a range of architectures our application will work on and after making changes based on a scientific guess, measure results. Things like predictive prefetching in CPU, proper timing, multi-core systems calls can make it tricky.
All code used to write this article can be found, as usual on my GitHub.
Comments